
Top 10 Features: Analysis tools and Quality Check – Part 2
This month we propose an overview of the Quality control tools that allow you to analyse the aesthetic aspects and the shape of a 3D model made with ThinkDesign.
In the first article on this topic, we described some methods to check the quality of a model on the basis of some geometric parameters (for example: volume, size, etc. …), and evaluate the acceptability of the design choice made.
This second article on the same topic, instead, is an overview of the check tools that allow the analysis of appearance and shape characteristics of a 3D model built with ThinkDesign.
These tools are particularly useful for models with complex shapes, including more faces /surfaces, and for which the timely analysis already described would appear difficult and time consuming.
In these cases it is necessary to apply particularly effective analysis tools that facilitate interpretation and reading of the shape characteristics of the model, through the use of special views.
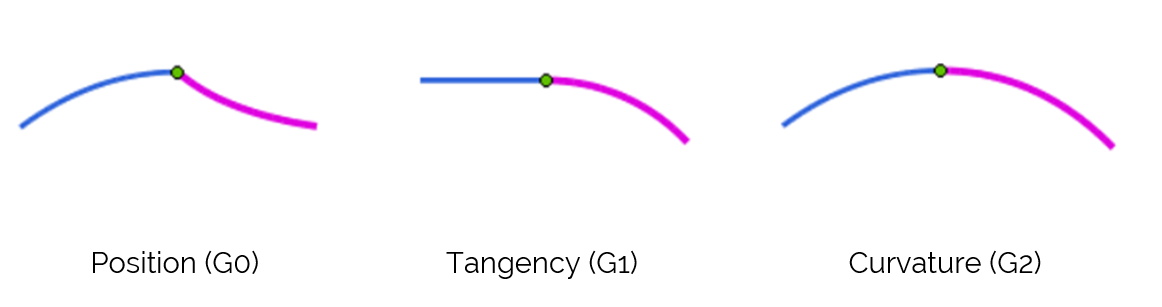
First of all, let’s proceed with some definitions that will be useful in the evaluation of the shapes and of the “continuity” between two surfaces. A condition of “Position continuity” between two curves (G0) occurs (exists) when two curves have a common contact point; a continuity of tangency, instead, defines the status in which two tangents, at the contact point, have the same angle (G1), and finally a condition of “curvature continuity” is present when also the radius of curvature has the same value and the same sign (G2).
Let’s extend this concept to the surfaces and consider, as a contact point, the common boundary between two surfaces/ faces. As for the position continuity we are in the presence of a sharp edge, in the case of tangency, instead, the contact point can be considered as “rounded”. Through the display mode of shading and by increasing the tessellation parameters, it is possible to make a first visual analysis of the model to identify possible discontinuity areas.
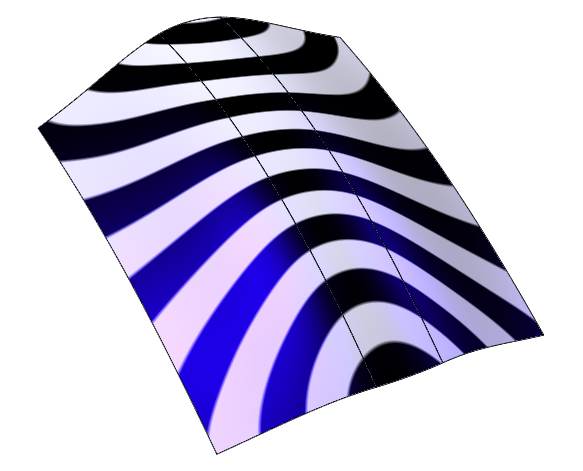
To analyze the shape and identify possible discontinuities between the surfaces, we need an important tool, the so-called Zebra Lines. This display mode allows us to project a series of colored stripes onto the model, which, according to the selected option, represent the incidence of a beam of light with respect to a certain direction (isophotes) or the reflection with respect to the normal of a striped texture projected onto the surfaces of the displayed model (reflections).
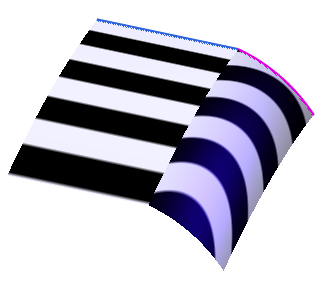
With this tool, the identification of any sharp edges is immediate. In the case of the image here below, for example, the misalignment of the strips highlights the discontinuity.
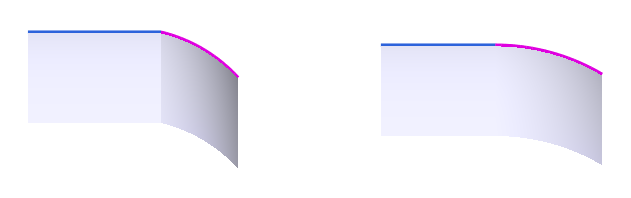
In the case of a condition of tangency, instead, the stripes appear aligned but discontinuous along the connecting boundary.
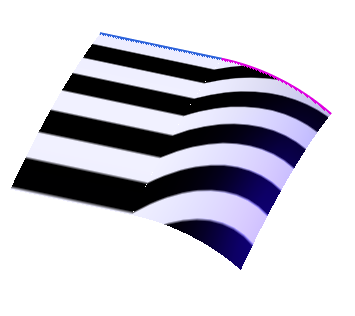
Sometimes the continuity of tangency may be insufficient to meet the desired appearance requirements. The example above shows, even in the case of tangency, an interruption of the curvature continuity between the line (curvature = 0) and the arc (curvature = 1/R), which appears very clearly thanks to the Zebra Lines. Think at surfaces that will be painted or also polished, or chromium plated, in any case they will reflect. In the junction point there will be an interruption in the curvature continuity and the image of the environment, reflected on the surface, will appear interrupted.
In the case of curvature continuity, instead, the course of the Zebra Lines appears “continuous”; the Zebra Lines are also useful to highlight areas of higher roundness, highlighting areas with softer lines with respect to areas with more rigid lines.
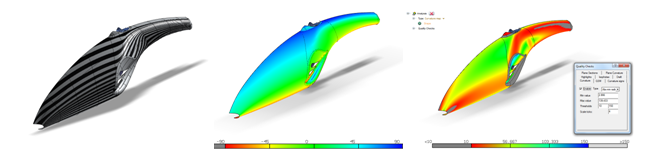
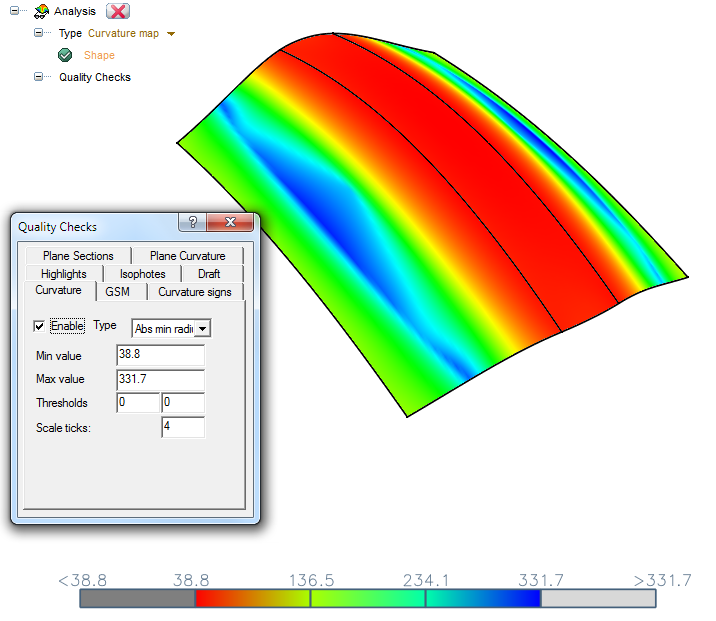
To this aim, it is particularly useful to measure the quantity of the areas with the greatest curvature, highlighted with the diagram of curvature. Thanks to the analysis of the “Map of curvature” and the analysis of the “Absolute Minimum Radius”, it is possible to view these areas and the variation of the absolute minimum radius of curvature in a 3D shape.
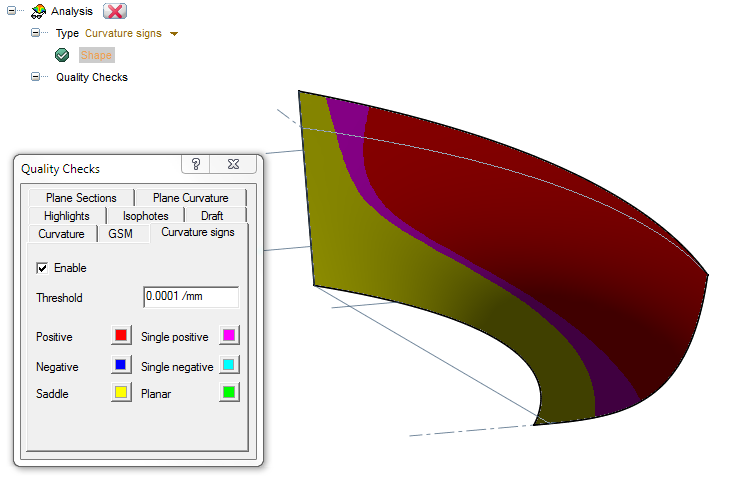
Using the “Curvature Signs” diagram, instead, it is possible to distinguish the plane areas from concave or convex areas, and hence identify any depression areas or saddles of a surface.
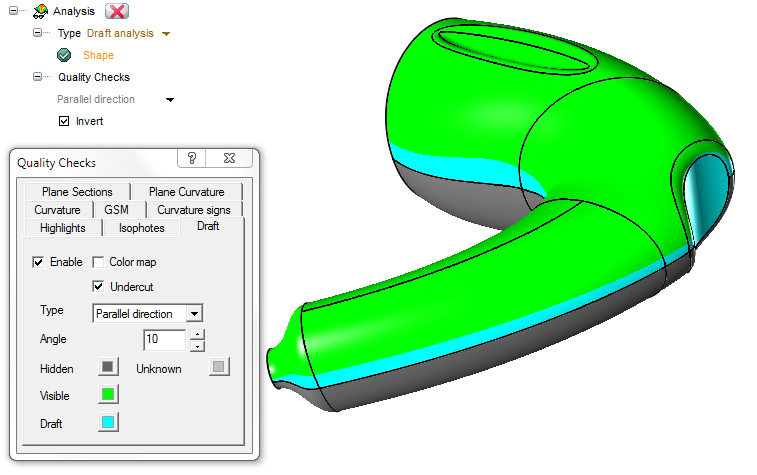
In the modeling of mold details, another tool, essential for control and evaluation, is the ”Draft Analysis”, useful for both identifying the exact area where the division line may be visible, and for recognizing areas with an insufficient draft angle.
According to the implemented production process, the shape of the model greatly influences the quality of the final product. Thanks to the analysis tools, it is possible to evaluate in advance, quickly and effectively, the shapes of the product that you are planning. This allows you to timely perform adjustments and changes necessary to improve quality and save production times.